
Tech Stack
Description
LLM Observatory is a self-hosted proxy and monitoring dashboard for the Anthropic API. Every LLM call my applications make flows through it, gets logged to Postgres, and surfaces in a real-time dashboard, giving full visibility into cost, latency, and token usage as it happens.
LLM costs are billed per token and accumulate fast: a prompt that works fine in testing can get expensive at scale if it's longer than it needs to be, or if it's running on a heavier model where a lighter one would do. Catching that early, rather than at the end of the month, is the whole point of the project.
Implementation
The backend is a FastAPI proxy that streams the Anthropic response back to the caller without buffering it. Metrics are extracted from the SSE stream as it passes through and written to Postgres via asyncpg only after the stream completes, keeping the critical path clean. The frontend is React with Recharts, served via nginx, with the whole stack wired together in Docker Compose.
Page Info
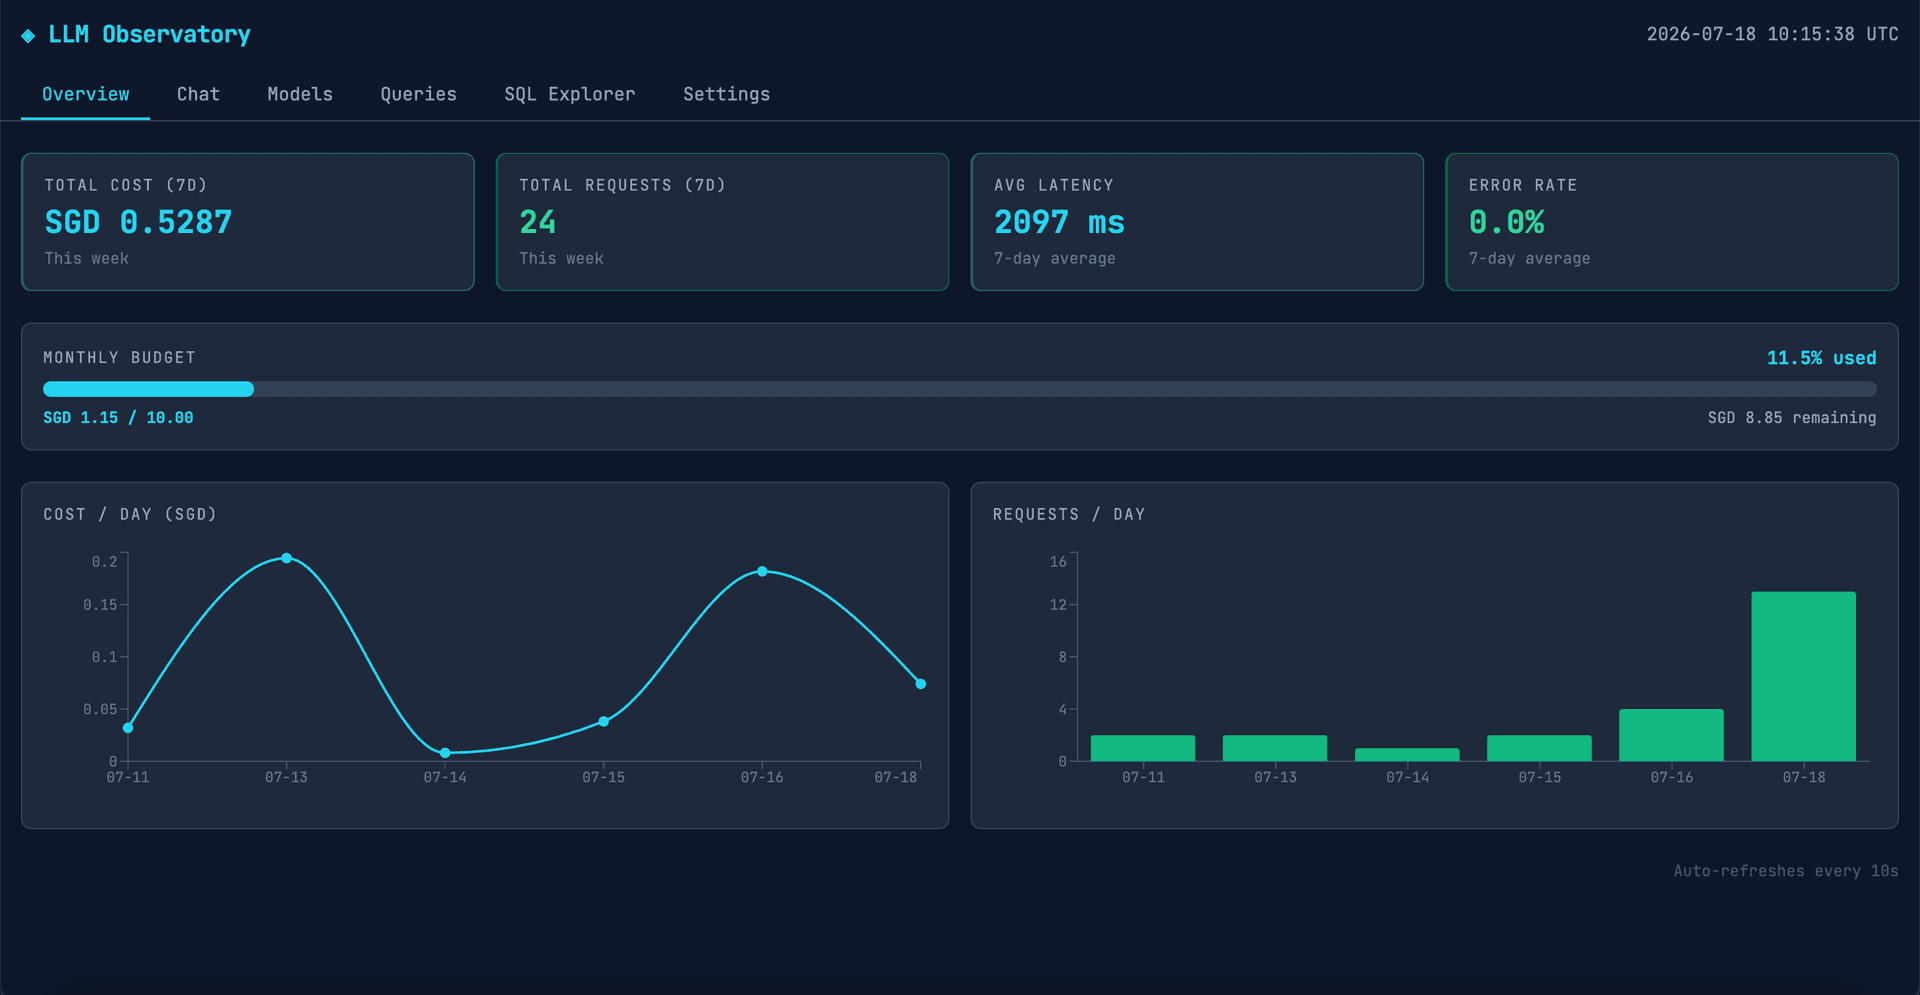
Overview Dashboard
Top-level stats for the last 7 days - total cost, request count, average latency, and error rate - plus a monthly budget meter and daily cost and request-volume charts. The whole view auto-refreshes, so runaway spend or a latency spike shows up the moment it happens.
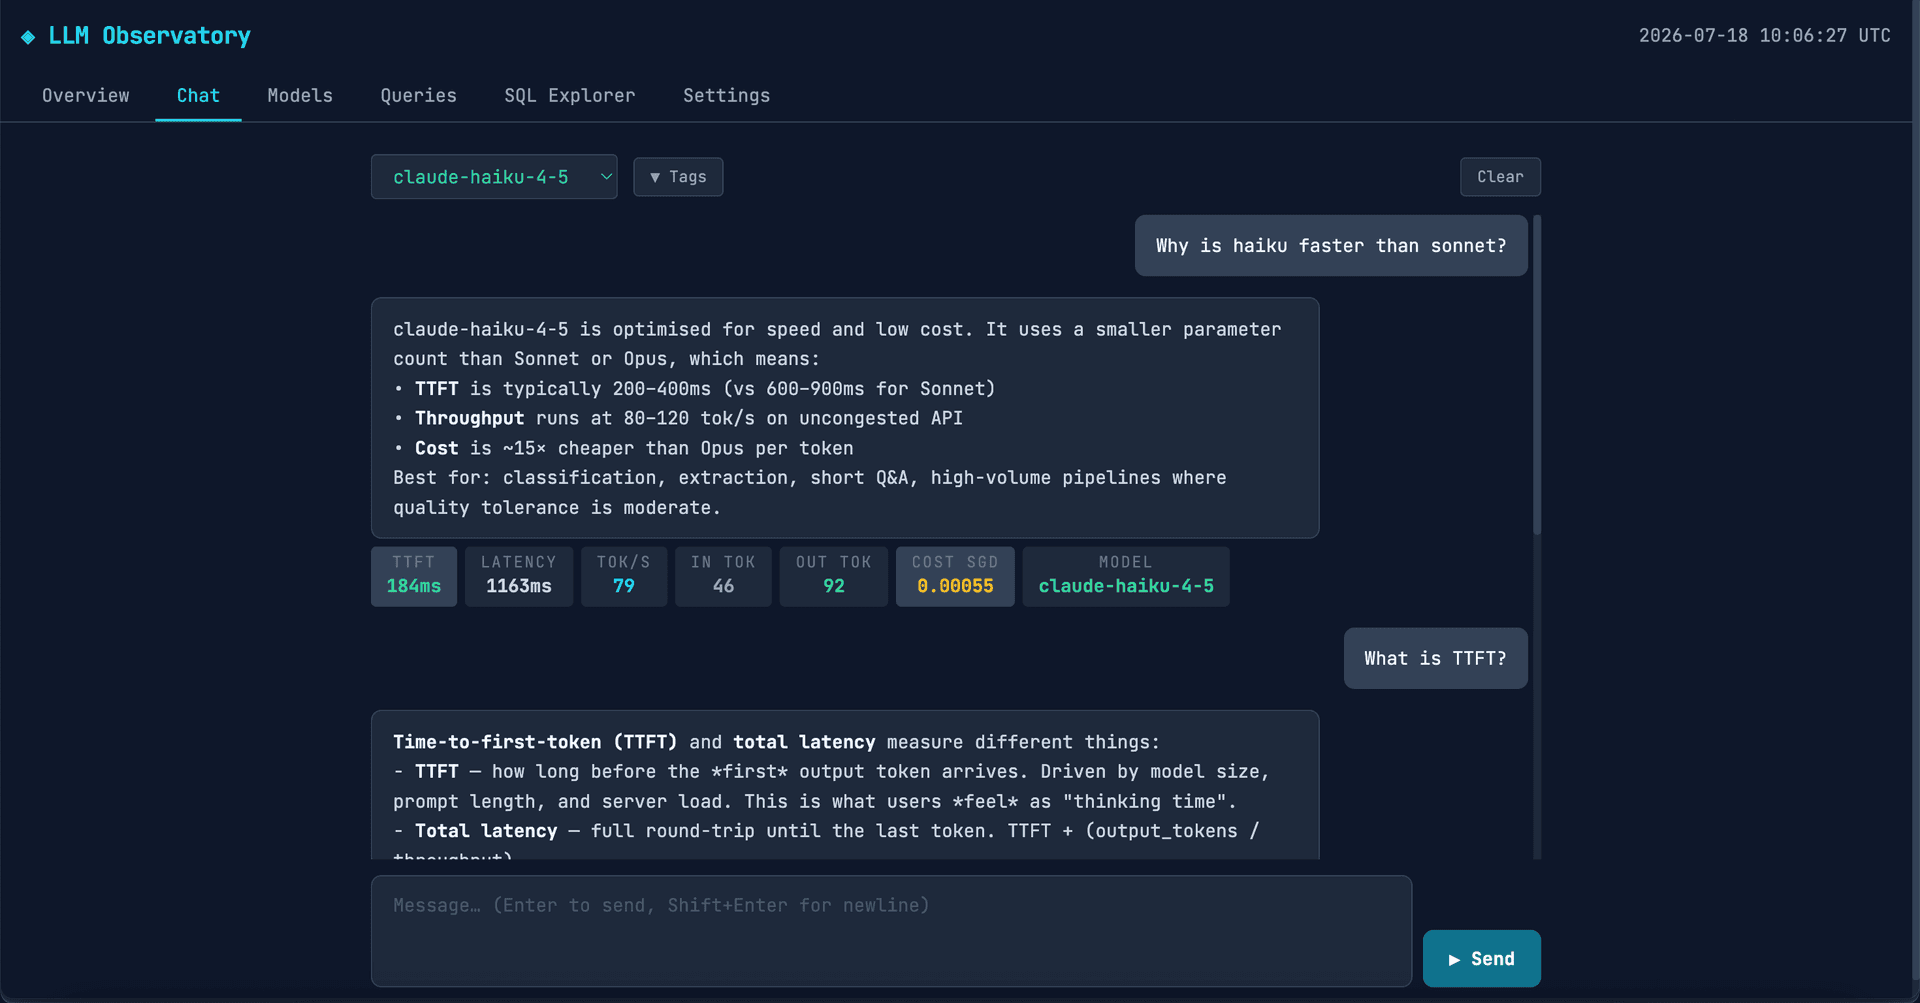
Chat Playground
An interactive playground for running prompts through the proxy against any configured model. Per-message stats stream in live - time-to-first-token (TTFT), total latency, tokens per second, input/output token counts, and cost in SGD - so you can feel the speed and price difference between models as you chat.
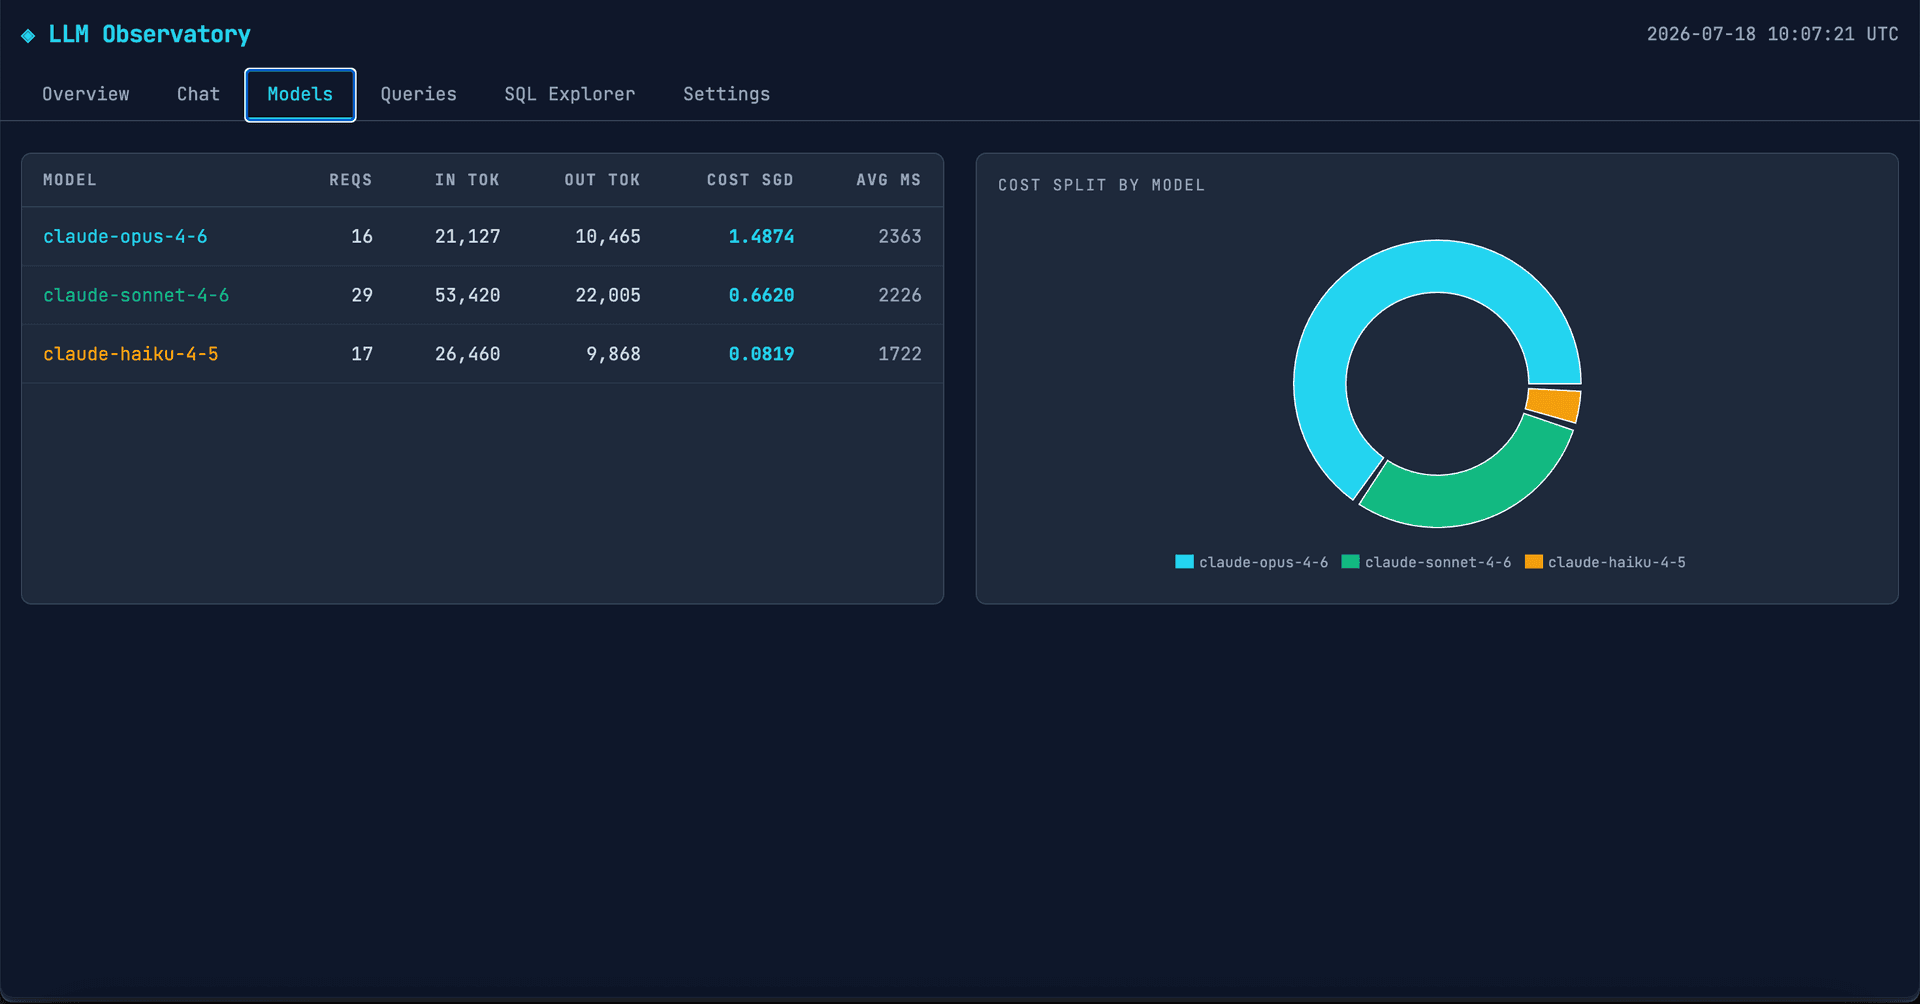
Models
A per-model breakdown of usage and spend: requests, input/output tokens, total cost, and average latency for each model, alongside a cost-split chart. Makes it obvious at a glance when an expensive model is doing work a cheaper one could handle.
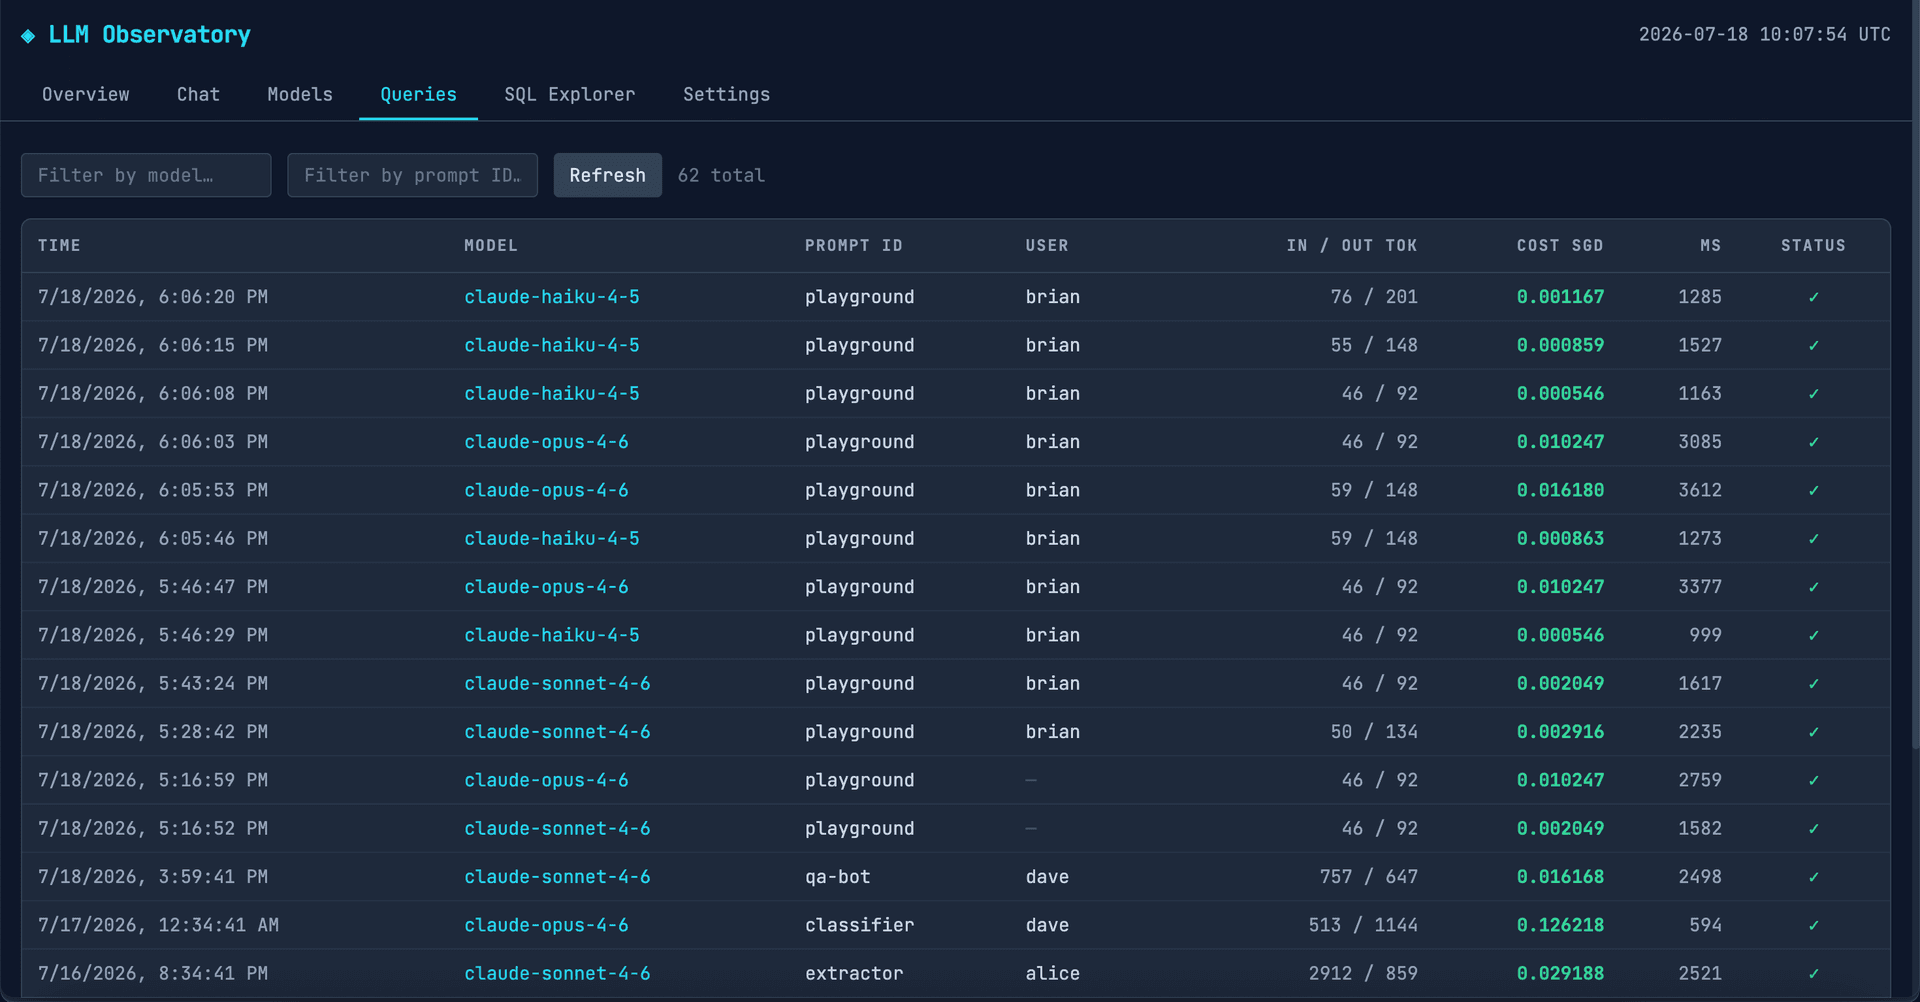
Queries
A searchable log of every request through the proxy, filterable by model or prompt ID. Each row captures the timestamp, model, prompt ID, user, token counts, cost, latency, and status - a full audit trail for debugging and cost attribution.
Future Improvements
- Retain structured metrics long-term while archiving or dropping raw prompt text after a retention window, to keep full-request storage viable at scale.
- Add alerting on spend spikes and request sampling for high-volume endpoints.
- Add multi-provider support across OpenAI, Gemini, and Anthropic.
- Explore semantic caching - returning cached responses for similar prompts via embedding similarity rather than exact match - to cut costs for applications with overlapping user queries.