
Tech Stack
Description
I had a growing collection of notes on AI topics - LLMs, agentic AI, RAG, orchestration frameworks and more - and got curious what the relationships between these concepts would look like as a knowledge graph. This project is the result.
Concepts and their relationships are stored as W3C-standard RDF triples in a Turtle file. At runtime, SPARQL queries retrieve the most relevant nodes and edges for a given question, which are passed as context to a local LLM running via Ollama. Unlike vector RAG, the retrieval step is fully visible: after each answer, the nodes used as context are highlighted on the interactive graph.
Implementation
- Concepts and relationships stored as RDF triples in a .ttl file, with named predicates like 'powers', 'resolvesHallucinationUsing', and 'extends'.
- rdflib builds and queries the in-memory graph; SPARQL selects the relevant subgraph at runtime.
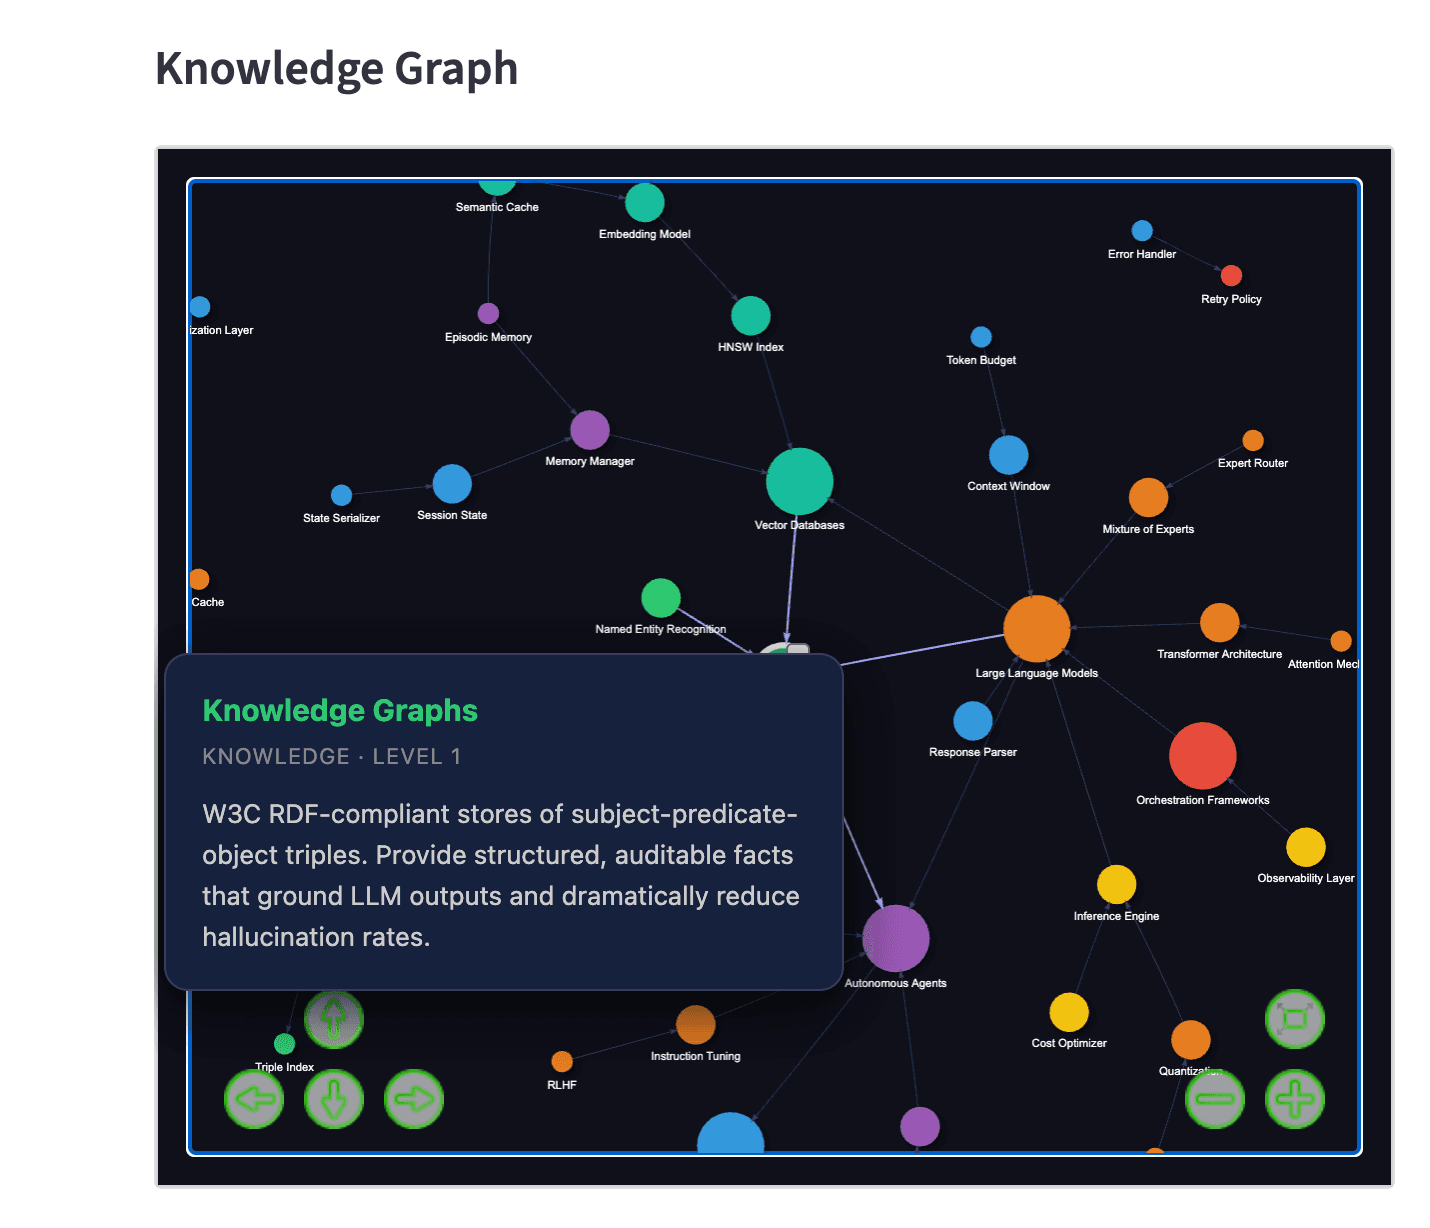
- Pyvis renders the interactive canvas with physics-based layout and hover tooltips.
- Ollama (llama3.1) runs the LLM entirely locally - no data leaves the machine.
- Streamlit ties the graph view and chat interface together in a single dashboard.
Page Info
Knowledge Graph
Interactive graph of AI concepts with physics-based layout and hover tooltips. Nodes represent technologies and ideas; edges represent semantic relationships like 'powers' and 'resolvesHallucinationUsing'. Filter by edge type or focus on a subgraph from the sidebar.
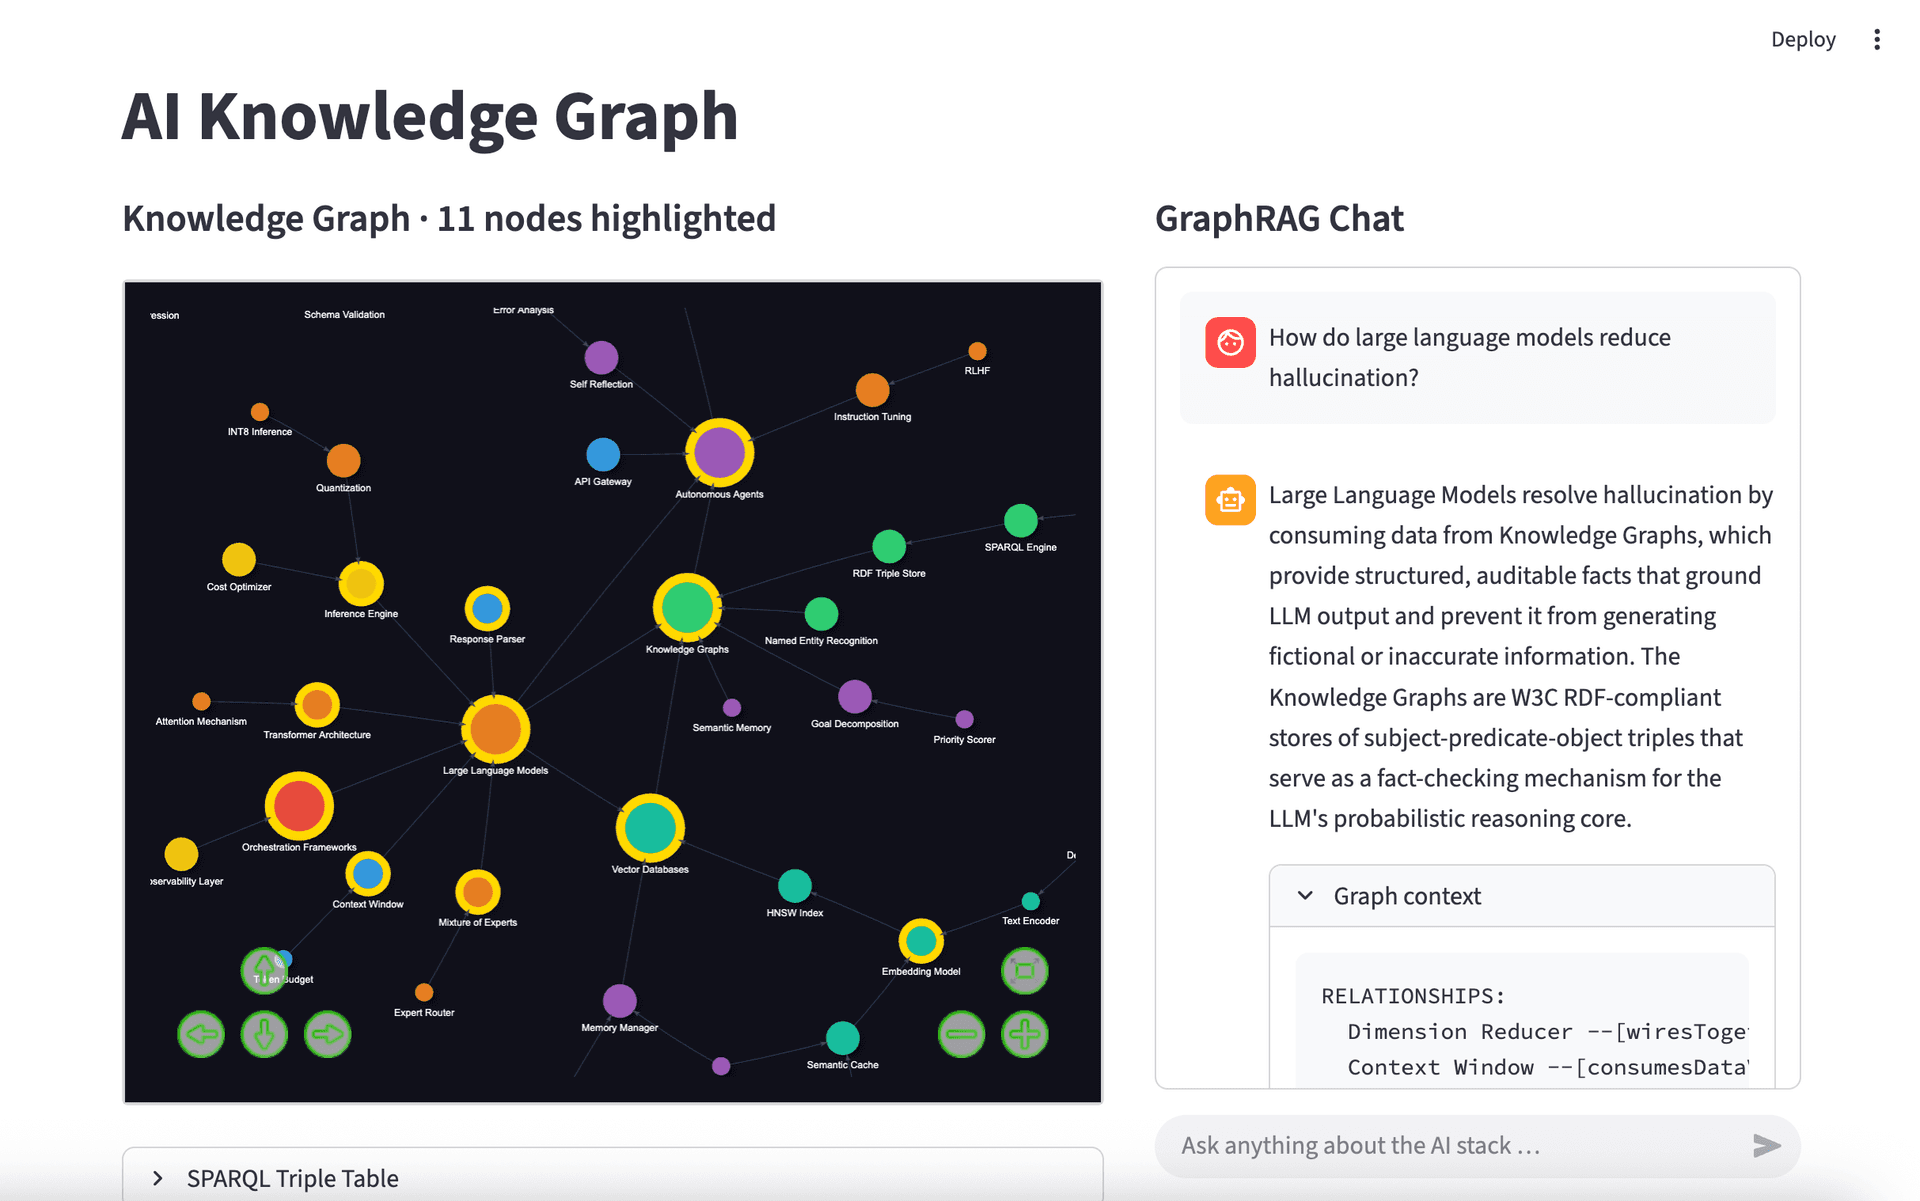
GraphRAG Chat
Ask a question in natural language. SPARQL queries the graph to retrieve the most relevant nodes and edges, which are passed as context to a local LLM via Ollama. After answering, the retrieved nodes are highlighted on the graph - making the retrieval step fully visible and auditable, unlike vector RAG.
Future Improvements
- Semantic search - embed node labels and descriptions into a vector store to find concepts by meaning rather than exact keyword match, feeding richer context into the GraphRAG retrieval.
- Multi-hop reasoning - follow chains of relationships across the graph to answer questions that span multiple concepts, not just direct neighbours.
- Temporal dimension - version the graph over time to track how understanding of a topic has grown or shifted.
Further Reading
This page is a compact demo built from a handful of my own notes. For what it actually takes to scale knowledge-graph construction with LLMs to production, I wrote up the full approach on Medium.
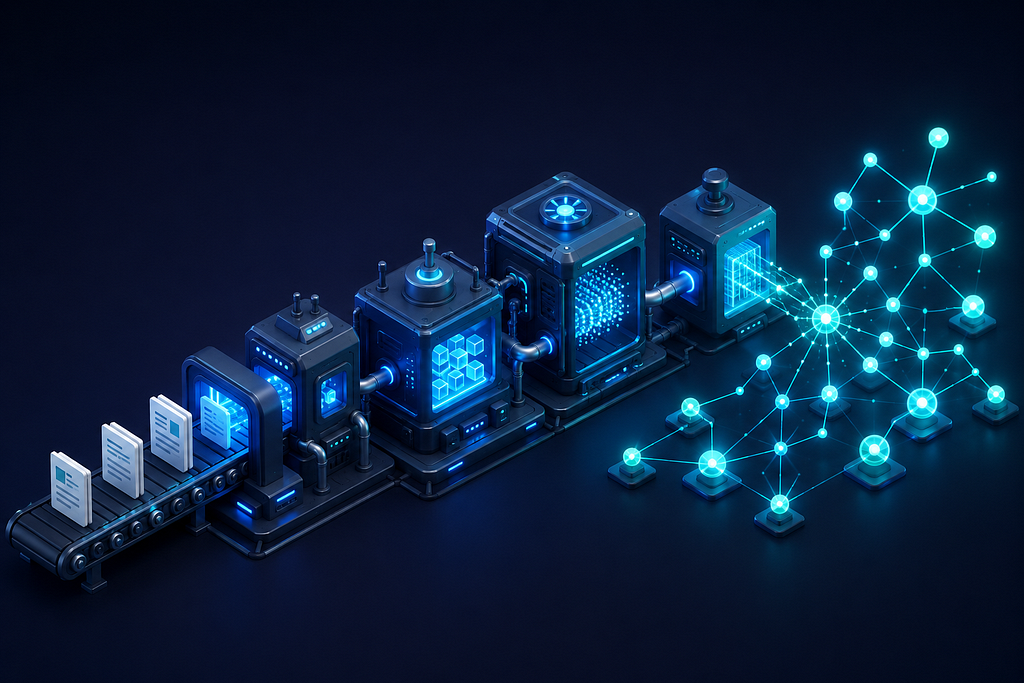
Building Knowledge Graphs with LLMs: What It Takes to Scale
The engineering challenges that turn a working demo into a production-ready knowledge graph.
Read on Medium